
Finding the best time to visit Trogir
The best time to visit Trogir depends on whether architecture, beach time or a boat excursion matters most. For walks, consider May, June or September before the hottest part of summer. For a trip built around the water, choose the activity and available departure dates alongside the weather outlook. A monthly climate average helps compare seasons; use a forecast for the actual day.
The historical regional series for Split-Marjan places July and August as the warmest months. May, June and September have lower monthly mean temperatures. This provides a useful starting point for choosing dates if long periods outdoors in high heat are uncomfortable. It does not predict the temperature during your stay or the conditions at a swimming stop.
For a city-focused visit, build the trip around the historic streets and choose your indoor visits separately. For time on the water, use the boat-trip comparison to decide between formats before selecting a departure. Keeping those choices together makes the month a practical decision rather than a single label for the whole destination.
Trogir weather and monthly climate
The DHMZ Split-Marjan series for 1948 to 2024 gives monthly mean air temperature and rainfall. These are historical regional values from Split-Marjan, with a data end point in 2024. The air-temperature mean combines the month’s observations; it is different from an average daytime high. Read the table as seasonal context rather than a forecast for Trogir.
In that series July has the lowest mean monthly rainfall and November the highest. Rainfall totals describe how much rain accumulated on average, rather than which dates were dry. Leave flexibility in an outdoor itinerary even in the drier part of the year. A city walk can be moved within the plan, while a boat excursion needs suitable conditions for its departure.
| Month | Monthly mean °C | Rainfall mm |
|---|---|---|
| January | 8.0 | 77.8 |
| February | 8.5 | 65.2 |
| March | 10.8 | 63.2 |
| April | 14.4 | 62.0 |
| May | 19.2 | 57.5 |
| June | 23.4 | 49.0 |
| July | 26.2 | 26.6 |
| August | 25.9 | 41.3 |
| September | 21.6 | 70.9 |
| October | 17.2 | 77.0 |
| November | 12.7 | 115.5 |
| December | 9.4 | 103.7 |
A half-day on the water
Check the weather and availability for this half-day boat outing.
Hand-picked tours, booked through Viator. Prices are indicative starting prices in euros (as of October 2026). Tap a tour for live availability and the current price in your currency.
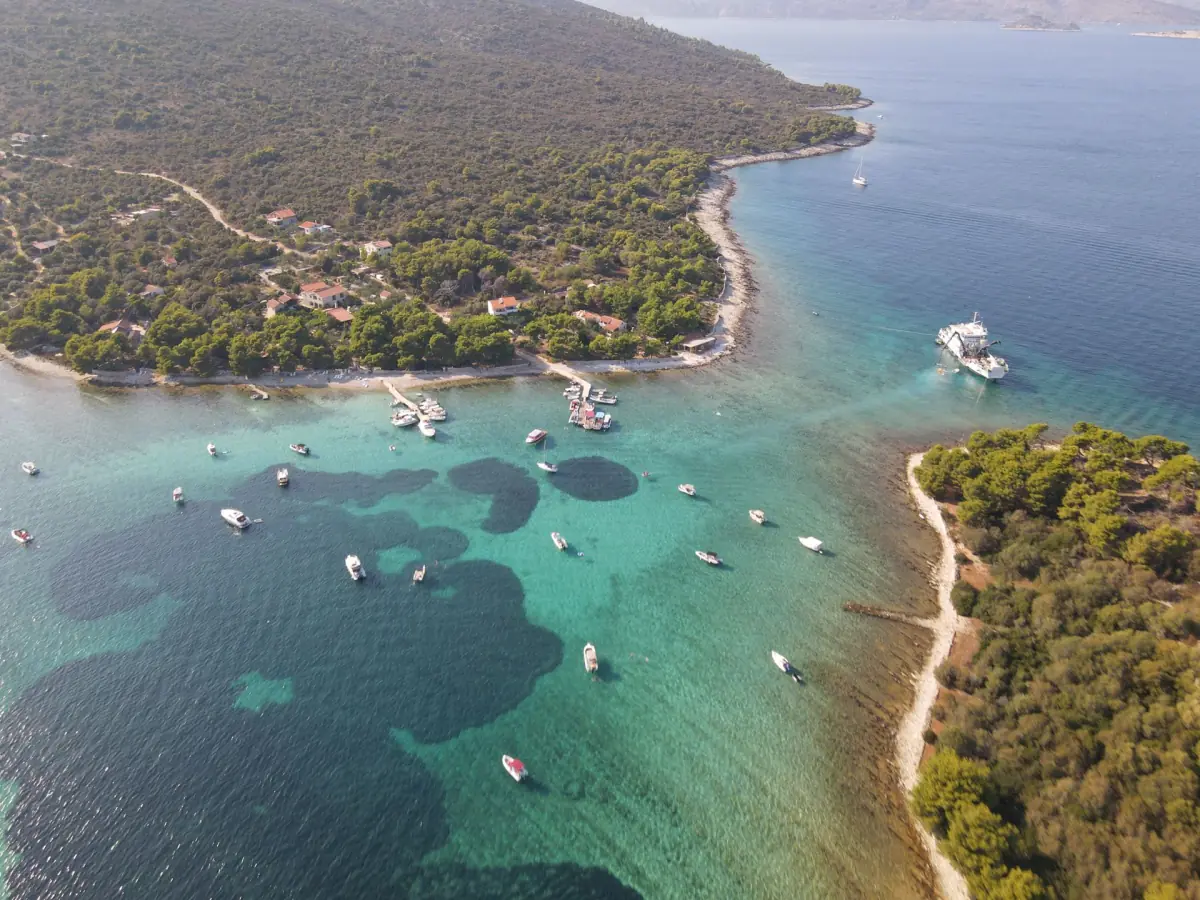
A half-day boat option for suitable conditions
The five-hour boat outing starts in front of Kamerlengo and includes a driver-guide, water, snorkelling equipment and safety gear. Choose a date with availability and suitable weather for the excursion.
Older daily high and low averages
A separate DHMZ dataset distributed through WMO for Split has the data label 15 June 2001 and an unspecified climate reference period. Its figures are older published averages of daily maxima and minima. They describe different measures from the monthly mean in the previous table, so keep the tables separate when comparing daytime and overnight conditions.
This older table is useful only as broad historical background. The July average daily maximum is 29.8 °C and the minimum is 21.6 °C in that dataset; those values are averages, not record extremes. Use the current forecast to plan clothing and the timing of walks, and avoid treating the older table as a modern climate normal for your travel year.
| Month | Mean daily maximum °C | Mean daily minimum °C |
|---|---|---|
| January | 10.2 | 5.3 |
| February | 11.0 | 5.5 |
| March | 13.7 | 7.6 |
| April | 17.4 | 10.8 |
| May | 22.5 | 15.2 |
| June | 26.7 | 18.8 |
| July | 29.8 | 21.6 |
| August | 29.5 | 21.5 |
| September | 25.1 | 18.1 |
| October | 20.0 | 14.1 |
| November | 14.9 | 9.9 |
| December | 11.5 | 6.8 |
Summer heat and sightseeing
The Split-Marjan historical series for 1948 to 2024 records an average of 18 July days and 17 August days with a maximum of at least 30 °C. For a summer visit, place a demanding outdoor walk in the part of the day that suits the forecast and your tolerance of heat. Bring water and leave space for breaks rather than filling every interval with another stop.
Plan the cathedral visit around its current access arrangements and keep the wider city walk flexible. For a stay near the coast, decide whether a beach base on Čiovo suits your daily plans. A waterfront setting and a warm month should be considered separately from swimming conditions on a particular day.
Boat season and winter transport
The seasonal passenger boat linking Trogir and Split stopped after its final operating day on 29 October 2026. The announcement suspends that service from 30 October 2026 until May 2027. Use the road connection when organising winter travel and consult the arrival guide for bus planning. The passenger service’s calendar is separate from the availability of individual excursion boats.
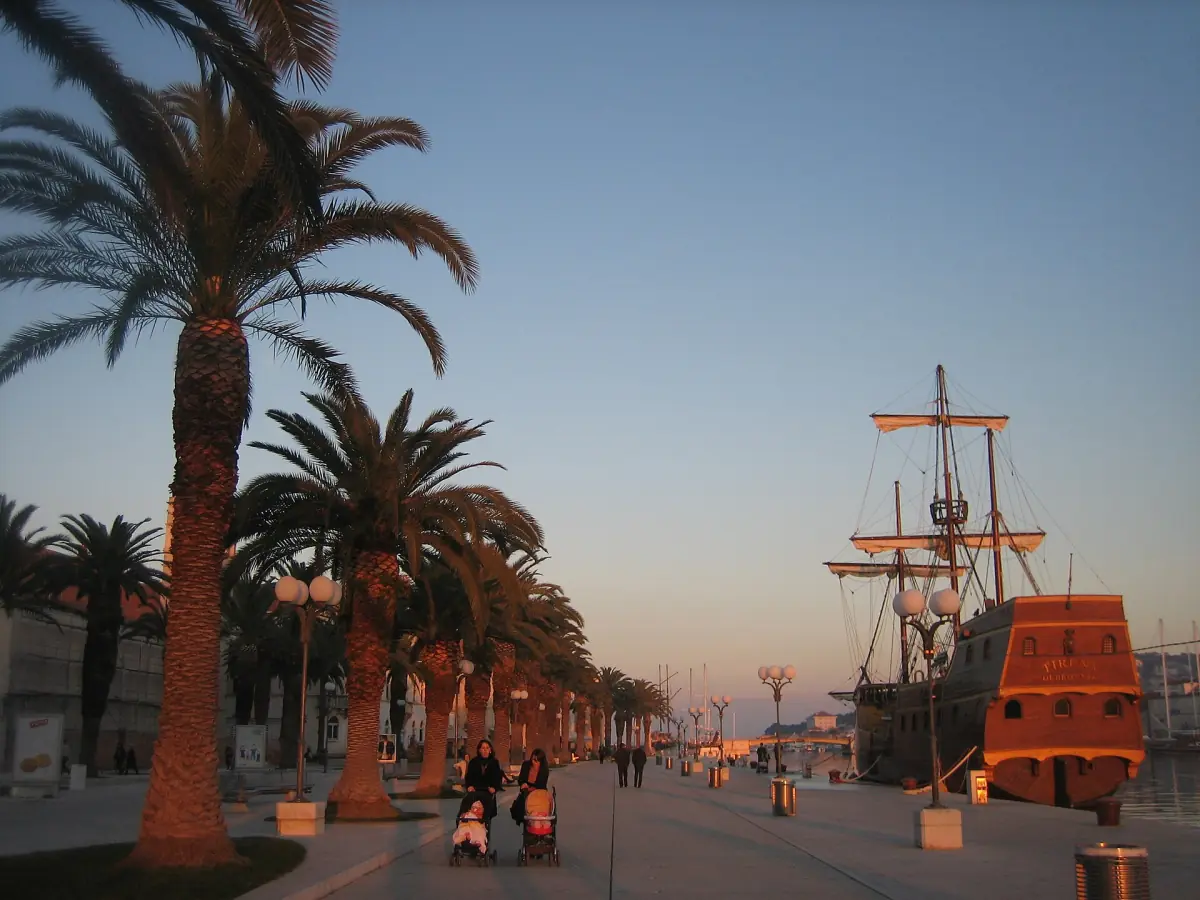
For a boat-led trip, select an available excursion for your dates and keep another activity in reserve if conditions change. The featured half-day option is weather dependent. A sunny city photograph illustrates the destination, while the decision to run a particular boat belongs to that day’s arrangements. This distinction matters more than choosing a month from a climate table alone.
Questions about timing a visit
Which months are worth considering for city walks?
May, June and September have lower monthly mean temperatures than July and August in the historical Split-Marjan series. Choose dates around your heat preferences and use the forecast nearer the trip.
Are these measurements from Trogir in 2026?
The monthly-mean table is the historical Split-Marjan series for 1948 to 2024. The daily high and low table is an older Split dataset labelled 15 June 2001.
Does the winter passenger-boat pause set the season for excursions?
The announced pause concerns the seasonal Split passenger connection. Individual excursions have their own available dates and weather decisions.